Morphological Operations – Looping Through Images
We continue with exploring the applications of morphological operations. This time around, we are making use of morphological operations to identify and isolate certain structures within an image, in particular, ‘cancer’ cells or circles that are slightly bigger in comparison to other circles in the image.
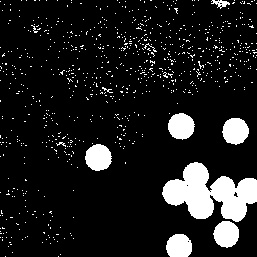
We start of with a plain image of circles as shown below. We take only a portion of it (size 256×256), since we’re only doing this to demonstrate the entire process and use the im2bw function to binarize it.
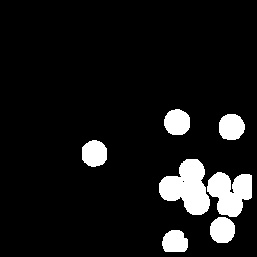
To clean the image, I used a 2×2 square structuring element, eroded the image a number of times, and then dilated the result by the same number of times. This process will get rid of the stray dots that we can see in the image. The result is shown below.
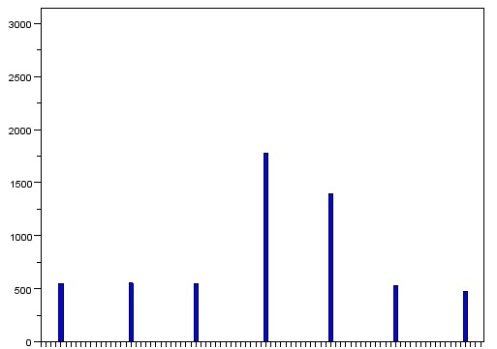
It is possible to further process the image in order to separate the connecting circles, but this will do for now. In total, we see seven white blobs. We want give these blobs separate values so when we get the histogram of the image, we can see the total area in pixels of each blob. Unfortunately, I still haven’t been able to make use of the IPD toolbox, so I made use of a clustering code that I had written some time ago for another class. The clustering code assigns a different value to each pixel that is ‘on’. It then compares the values to the adjacent nonzero pixels, copying the larger value. The end result is that each cluster will have a single value. It’s then a simple matter of reassigning values and then taking the histogram of the image.
As expected, we see seven bins with values (I had already removed the zeros and increased the number of bins in order to space the bars in the histogram). The larger two represent the blobs of three circles that had clustered together while the rest represent individual circles. From this histogram, we can estimate the average size of the regular circles.
We then move on to isolating the cancer cells. The image is filled with circles, some being cancerous, or slightly larger than average. We do the same as above by taking only a portion, one that has a cancer cell along with regular circles, binarizing the image, cleaning it with erosion and dilation, and then clustering it.
We take a look at the histogram. This time, we are looking for a value that is only slightly bigger than average. We will ignore the larger two because we can tell that it is simply the combination of two or more circles.
The first bar on the left is the bar that represents the area of the cancerous cell. We take note of its area and then filter the image to show only clusters with that size range. The result is as follows.
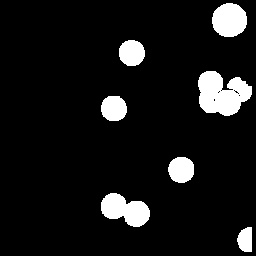
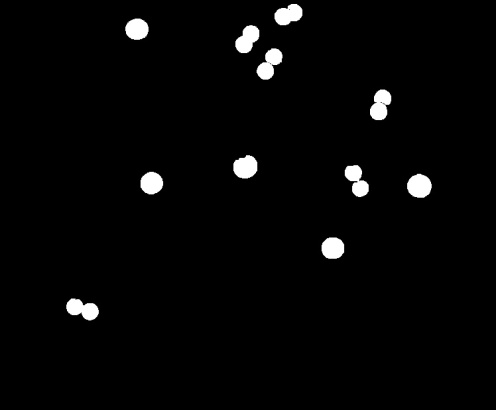
Now that we are capable of isolating a cancer cell in a portion of the image, we can just apply the same to the entire image. However, this was the result.
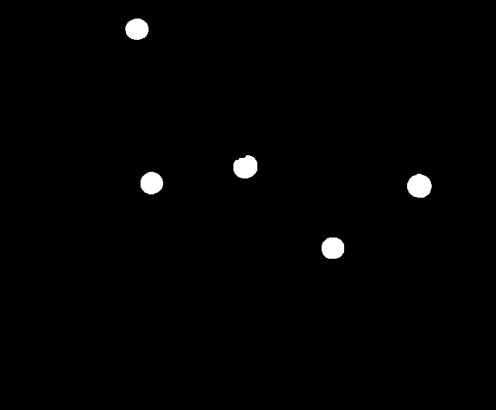
Other than the five cancerous cells, other clusters composed of two connected circles also appeared. It is possible to avoid this result by performing more erosions and dilations, but doing this too often can lead to loss of data. Instead, from this image, we apply a single erosion with the structuring element being the size of the cancerous cells. With that done, we then have a bunch of points localized at the centers of the cancerous cells. We add this to the image above, run the clustering function again so that the added values will cover the entire blob, and then filter the structures with lower values. The final result is shown below.
Having achieved the objective, but being a little late in posting, I will be giving myself a 9/10 for this activity.

